Initiating Probabilistically*
As I initiated my “Voyage of Discovery,” I found The Probabilities Sciences with which I was indoctrinated to be sufficient for all definable human circumstances. Indeed, The Probabilities Sciences dominated human existence and defined “the conditions” of our scientific experiments. To be sure, for 14 million years, since the first signs of hominid life, humankind, and nature have related to each other through one processing system: S–R Conditioning or reflex responding where there is no intervening processing between the presentation of the stimuli (S), and the emittance of a response (R).
Initiating Probabilistically
In this context, Parametric Science evolved in the 20th century. It defined the parametrics of phenomena and projected probabilities for their occurrence. For example, the entire area of parametric statistics evolved from agrarian applications: rows and columns of agriculture were treated differentially. The deviations or variability of phenomenal distributions around some estimate of central tendency were selected to meet environmental or marketplace requirements. Thus, the controlling function of science was enabled by the describing and predicting functions. The Probabilities Science of today was defined by The Parametric Models of Measurement.
| FUNCTIONS | PROCESSING | MEASUREMENT | |
|---|---|---|---|
| PROBABILITIES SCIENCE |
|
S–R Conditioned Responding Systems |
Parametric Measurement |
*Carkhuff, R. R. The Human Sciences. Amherst, MA: HRD Press, 2012.
The contributions of Gauss, Pascal and others to Probabilities Science have enabled all processors to construct a world of Probabilities Mathematics and Normal Curves. They have empowered us to start our “Voyages of Discovery.” The problem is this: They are inadequate in the manner which they pursue the mission of science, “The Explication of the Unknown.”
In the simplest terms: God has never made any species of life equal in their operations. Let alone Symmetrical Distributions! Only with “man-made” things do humans seek to impose “Statistical Process Controls” with “Equal-Interval Measurements” in order to narrow the tolerances of his tools and products!
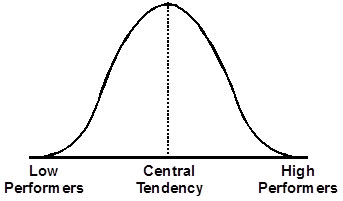
To be sure, one of the “miracles” of Probabilities Science was “The Normal Curve” (see Figure 1). The Normal Curve is a unimodal frequency distribution curve. Its scores are plotted on the “X axis” and their frequency of occurrence on the “Y axis:”
“It is the lifeblood of descriptive statistics” for any characteristics of any phenomena, human or otherwise. (Sprinthall, 2003).

Figure 1. The Normal Distribution of Parametric Measurement
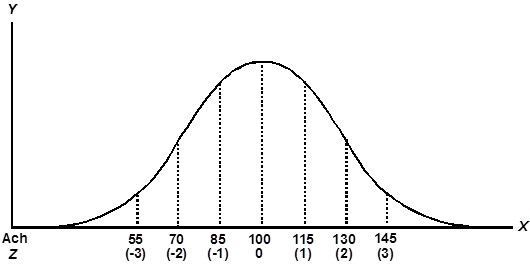
“The Normal Curve” serves many functions (see Figure 2). Among them are the following:
- 1. The central tendencies converge to reduce the variability beyond these averages.
- 2. Because of the symmetry of the curve, precisely 34.13% of the scores fall within one standard deviation of the mean.
- 3. As we move further from the mean, a declining number of scores fall within two (13.59%) and three (2.15%) units of standard deviation for a grand total of 99.74% of the scores.

Figure 2. The Normal Distribution of Measurements
It is this precision in description that makes The Normal Curve powerful in the interpretation of raw score performance. Succinctly, it takes into account the central tendencies, the variability, and the standard deviation. This empowers us to gain an understanding of individual phenomenal performance relative to the phenomenal performance of others in the reference group. Moreover, we can compare individual performance on two or more normally distributed scores.
As useful as the normal distribution is for comparing performance, it is also a powerful source of controlling performance. Among other controls are the following (see Table 1):
Table 1. Rules for “Controlling” Probabilities
| Levels | Operations |
|---|---|
| 5 | Controlling Development of New Curves |
| 4 | Reinforcing Movement Outside of Curves |
| 3 | Reinforcing Movement within Curve |
| 2 | Predicting Placement in Curve |
| 1 | Defining Normal Curve |
The Normal Curve, while defining the parameters of characteristics such as intelli-gence or performance, also limits the reference group’s standards for achievement. Fur-thermore, it is used to reinforce individual movement both within and outside the curve of achievement, thus limiting aspirations or intentions for achievement. Finally, it directly controls the development of new curves, thus limiting the progress to achievement in new areas of performance, such as new areas of intelligence.
In summary, while The Normal Curve fulfills descriptive and predictive requirements, it also “controls” the standards of achievement for the people or phenomena being addressed. For example, it tends to limit our thinking to “Best Practices” in all areas of human endeavor. Indeed, often it is not until people are “forced” by the exemplary performance of others that they create new visions and missions and thus new curves for performance.
Probabilities Science gives us an image of the Probable. In our work, we label this “The Current Operating Paradigm” or “COP.” Because we seek “The Productive Operating Paradigm” or “POP,” we label the first a “COP-OUT.” It may be “The Best Practice,” but it is never “The Best Idea!”
The “net” of Probabilities Science and Parametric Measurement is that it is a “heuristic” place to start processing! It provides a structure which constitutes the “Processing Threshold” of all sciences and all processing. It is itself a “Hypothetical Construct of Reality” calculated to initiate processing.
